In our previous post we described the research we will be doing on all-Fe flow batteries using water-in-salt (WiSe) electrolytes, thanks to the grant from NLnet. One of the first questions in that list was how the concentration of the WiSe salt affects the efficiency and stability of these batteries. Today I want to share the first set of results on this question, where we look at MgCl2 at different concentrations while keeping everything else in the battery the same.
For these experiments we used 1M FeCl2 (prepared from FeCl2.2H2O) and changed the MgCl2concentration from 3M up to 6M, with a 4.5M experiment in the middle. All the batteries were cycled at 10mA/cm2 using the same pump speed, charged to 20% of their total SOC and then discharged down to 0V. The actual electrolyte volumes ended up being different between experiments (from 9mL down to only 6mL for the 6M solution), so comparing capacities in mAh would be misleading. For this reason all capacities in this post are normalized by volume and reported in Ah/L. With this normalization the charge capacity is 2.68Ah/L in all cases, which makes the comparison a lot easier.
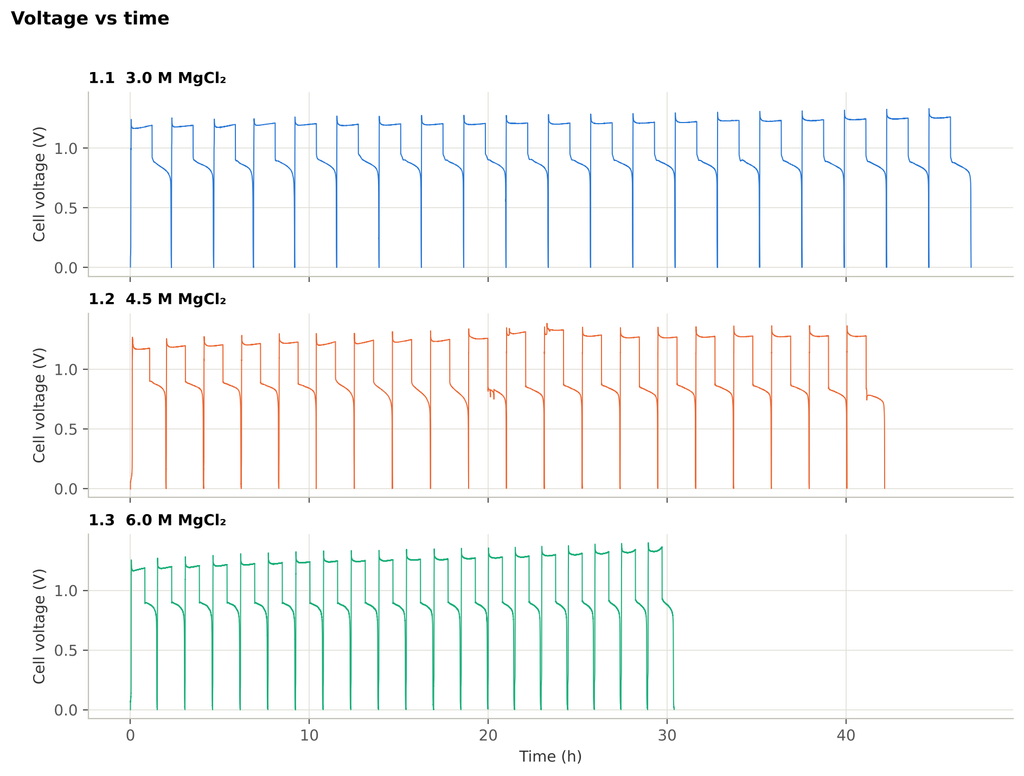
The graph above already shows that the batteries behave quite differently even though they start from very similar places. The first cycle had a low CE in all cases (86-90%), which is something I have seen before with these systems and is basically a conditioning effect of the electrolyte as the Fe chloride is partially oxidized (as it oxidizes slowly in air as a solid) and some electrons during the first cycle are just wasted reducing this Fe. After that, things start to diverge.
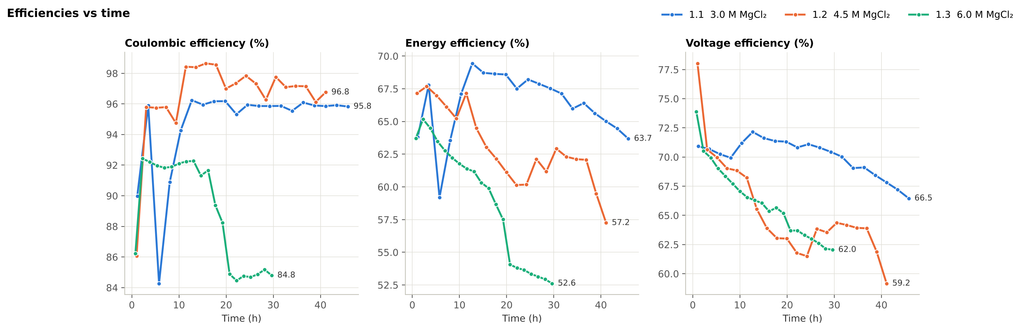
The 3M MgCl2 battery was the most stable one by far. Its CE was a bit erratic during the first 10 hours (one cycle dropped all the way to 84%) but then it settled at around 96% and stayed there for the whole 47 hours of cycling. The EE did start to go down after around 25 hours, ending at 63.7% after peaking close to 69%, but this decline was very slow compared to what we saw in the other two batteries. If we fit a line to the data the EE goes down by only 0.02% per hour.
The 4.5M battery actually gave the highest CE values of the series, between 97% and 98.6% for most of the test. With that said, the EE went from about 67% down to 57% in 42 hours, and since the CE barely moved, pretty much all of that loss comes from the voltage efficiency. There is also a jump at around 20-25 hours that is visible in all the graphs, and the discharge curve of cycle 10 shows some spikes. These were caused by a pump failure we had during this experiment, which interrupted the flow of electrolyte through the cell, so I wouldn’t read too much into that part of the data.
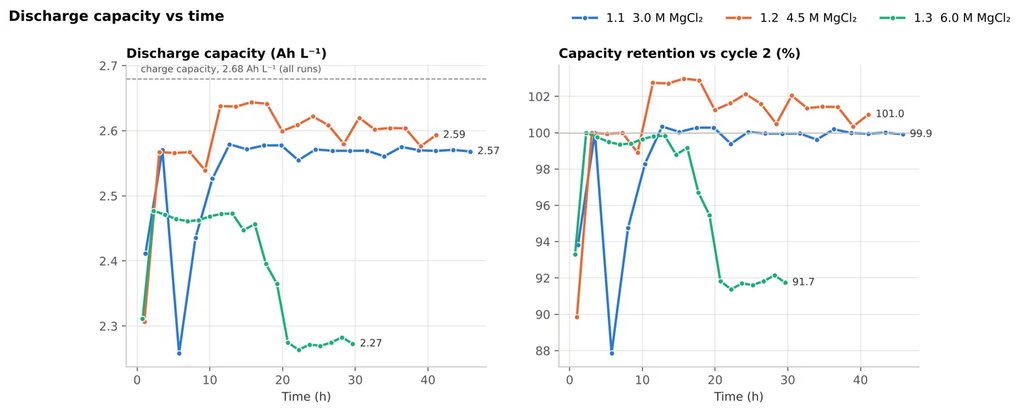
The 6M battery is where things went clearly wrong. The CE started lower, at about 92%, and then fell sharply between 17 and 21 hours to around 85%. It never recovered after this. The discharge capacity dropped at exactly the same time, from 2.47Ah/L to 2.27Ah/L, which is a loss of about 8%. The EE ended at 52.6%, the lowest of the whole series, and it was declining at around 0.5% per hour, more than 20 times faster than the 3M battery. This battery also ran for the shortest time, because we had to stop the experiment after around 30 hours when the electrolyte started leaking. The leak was caused by clogging from Fe oxides that built up on the anolyte side, so by the end the battery was in quite bad shape.
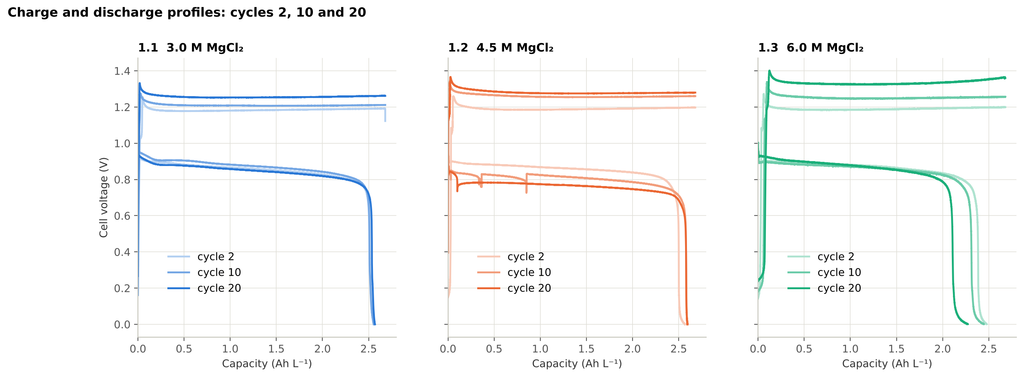
The voltage graphs help us understand where the EE losses are coming from. The gap between the average charge and discharge voltages grew in every battery, but in the 3M one it only went from 0.35V to 0.42V over 47 hours. For the 4.5M and 6M batteries the gap reached around 0.5V in 30-40 hours. The end of charge voltage of the 6M battery reached 1.40V after only 30 hours of cycling, and it was still going up when the experiment ended.
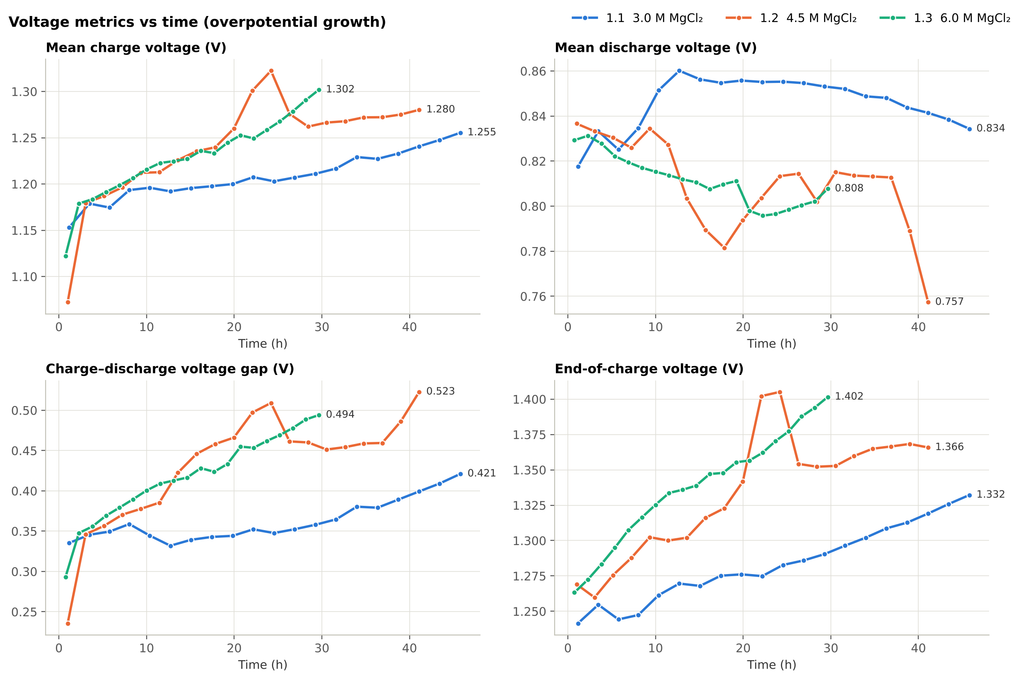
Why would more MgCl2 make things worse? Concentrated MgCl2 solutions are quite viscous and their conductivity goes down as you add more salt, so I expected higher overpotentials at 6M from the start. What surprised me a bit is that the initial overpotentials were actually very similar, and the difference comes from how fast they grow. This suggests that something is building up in the cell over time, and in the 6M case we know at least part of the answer. The Fe oxides that clogged the anolyte side would also cover the electrode and make it harder for the electrolyte to flow through it, which fits nicely with the growing overpotentials. I believe the sudden drop in CE and capacity at 17-21 hours is the point where this clogging started to really affect the battery. Why the oxides built up so badly at 6M is something I don’t have a good answer for yet, and it is one of the things we will try to figure out with more cycling experiments.
Long story short, adding more MgCl2 does NOT make for a better all-Fe battery. The 4.5M electrolyte gives a slightly better CE, but the 3M electrolyte keeps its efficiency and capacity for a lot longer, which is what really matters in a flow battery. The next step will be to run the same comparison using CaCl2, and to do some longer tests at 3M to see where the slow EE decline ends up. The raw cycling data for these experiments will be released together with the rest of this first batch of results.
Thanks to NLnet for supporting this research!