In our last post we looked at how the concentration of MgCl2 affects all-Fe flow batteries using water-in-salt (WiSe) electrolytes, and we found that going higher in concentration was not a good idea, with 3M giving the most stable battery by far. As I mentioned at the end of that post, the next step was to run the same type of comparison using CaCl2. Today I want to share these results, which turned out to be quite different from what we saw with MgCl2.
For these experiments we used 1M FeCl2 (prepared from FeCl2.2H2O) and changed the CaCl2 concentration from 3M up to 5M, with a 4M experiment in the middle. All the batteries were cycled at 10mA/cm2 using the same pump speed, and in every cycle they were charged to 20% of their total SOC before being discharged down to 0V. This time all the electrolytes had the same volume (8mL), but to keep things consistent with the previous post all capacities are again normalized by volume and reported in Ah/L. The charge capacity is 2.68Ah/L in all cases.
There are two things about the electrolyte preparation that I need to mention, since I believe they are important for the results. The first one is that the FeCl2.2H2O we are using contains some Fe3+ oxides that do not dissolve in the CaCl2 solutions, so we had to add 2 drops of 15% HCl to each electrolyte to get them to dissolve. The second one is that these solutions were NOT filtered. I ran out of PVDF filters and I have now ordered new hydrophilic PTFE filters, so for these tests there could be some small particles in the electrolyte that would normally be removed.
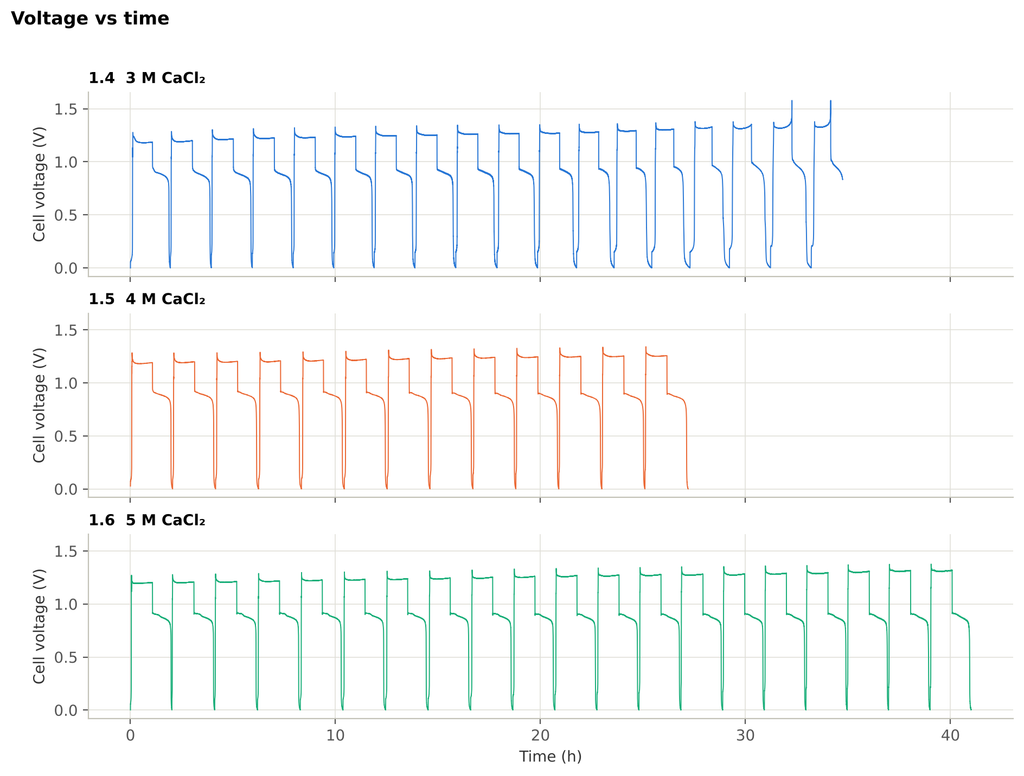
The graph above shows that the three batteries ran for very different amounts of time. The 3M test lasted around 35 hours and the 4M test only around 27 hours, and both had to be stopped because the electrolyte started leaking. In both cases the leaks were caused by iron hydroxides/oxides that built up on the anolyte side and clogged it, which is the same problem that ended the 6M MgCl2 test. The 5M test was not stopped and ran for about 41 hours, but when we looked at the cell afterwards there was also a substantial amount of these oxides on the anolyte side. So this time the oxide buildup was present in every single battery, which is something we will need to deal with before going much further.
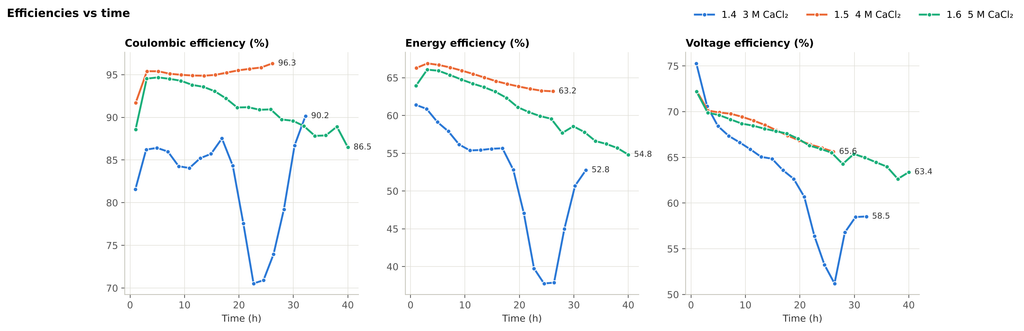
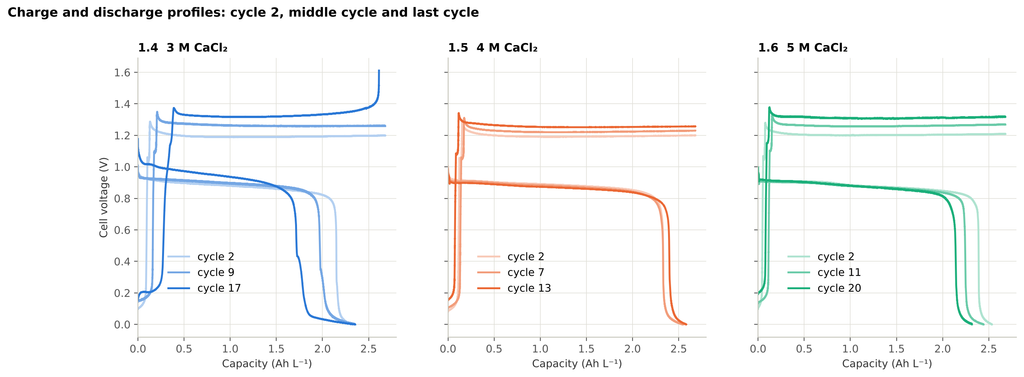
The 3M CaCl2 battery was the worst one of the series. This was quite surprising to me, since 3M was the best concentration in the MgCl2 series, where it held a CE of around 96% for 47 hours. With CaCl2 the CE never went much higher than 86-87%, and between 19 and 28 hours it dropped all the way to 70%, with the EE going down to around 38%. After this the battery seemed to recover, with the CE going back up to 90% in the last cycle. With that said, I wouldn’t trust these last cycles very much. The last charge shot up to around 1.6V and stopped before reaching the full capacity, and the last discharges have a long tail at very low voltage (around 0.03V) that adds capacity without adding much energy. I believe this is what the clogging looks like in the electrochemistry right before the battery started leaking. If we fit a line to the EE data it goes down by 0.58% per hour, which is the fastest decline of all the experiments in this post.
The 4M CaCl2 battery was the best one of the series. Its CE stayed between 95% and 96% the whole time and was actually going up slowly when the test ended. The EE went from 66.6% down to 63.3%, a decline of 0.18% per hour, which again comes mostly from the voltage efficiency since the CE barely moved. The capacity was also very stable at around 2.55-2.58Ah/L. The problem is that this battery also ran for the shortest time before it started leaking, so it is hard to know how it would have done over 40-50 hours.
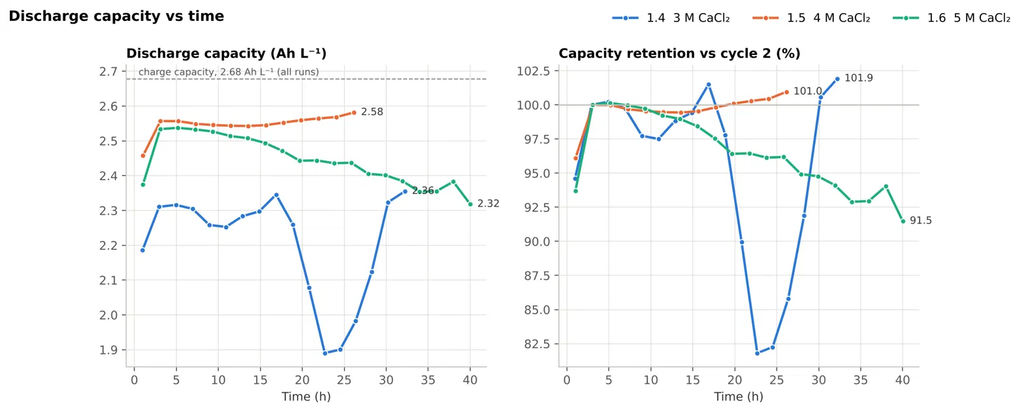
The 5M battery started almost exactly where the 4M one did, with a CE of 94.6% and an EE of 65.8%, but it declined steadily during the whole test. By the end the CE was down to around 87.8% and the EE to 55.6%. The capacity also went from 2.53Ah/L to 2.35Ah/L, which is a loss of about 8.5%. Unlike the 3M battery or the 6M MgCl2 battery, there was no sudden drop here, just a slow and constant decline from start to finish. Given the amount of oxides we found in this cell afterwards, I think it is very likely that this battery would have started leaking as well if we had kept it running for longer.
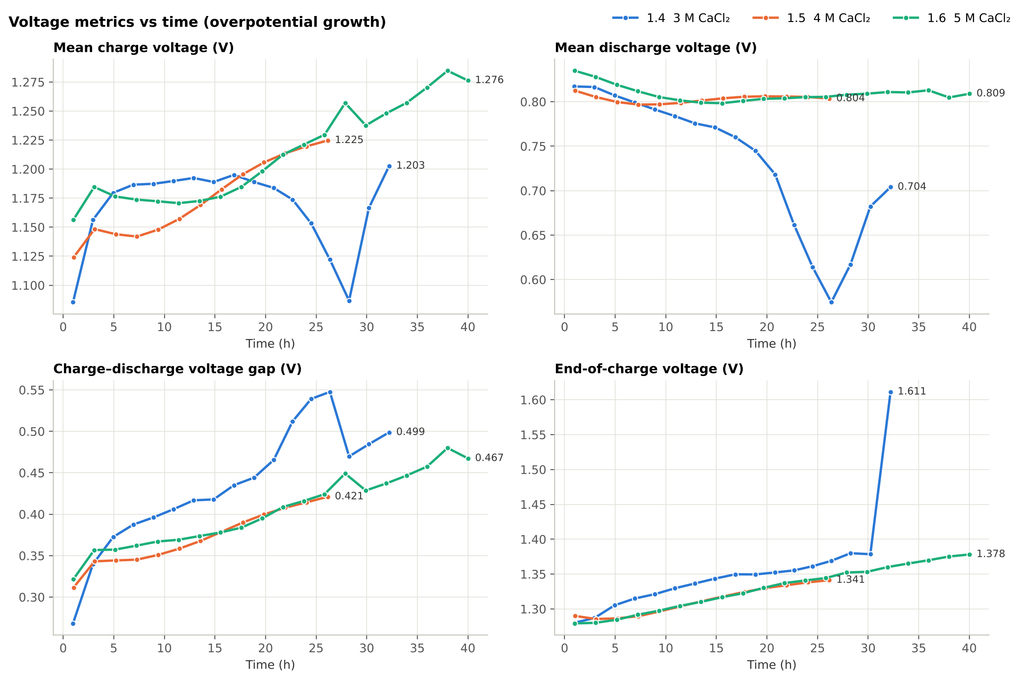
The voltage graphs show the same trend we saw with MgCl2. The gap between the average charge and discharge voltages grew in every battery, going from 0.36V to 0.47V in the 5M battery and from 0.34V to 0.42V in the 4M one. The voltage efficiencies of these two batteries are practically on top of each other while both were running, so the difference in EE between them comes mostly from the CE. The 3M battery had the fastest increase in the voltage gap, reaching more than 0.5V at the worst point.
So what is going on? The growing overpotentials and the oxides on the anolyte side all point to the same problem. As iron hydroxides/oxides build up they cover the electrode and block the flow of electrolyte, which increases the overpotentials, and at some point the pressure is enough to cause a leak. This is related with both the electrolyte preparation method and the pH drift caused by hydrogen evolution. The FeCl2.2H2O already contained Fe3+ oxides that needed HCl to dissolve, and without filtering it is quite possible that some undissolved particles made it into the cell and gave the oxides a place to start growing. The anolyte side is also where iron is plated, and any hydrogen evolution there would increase the local pH, which would make the precipitation of iron hydroxides even easier. Hydrogen evolution is likely the most important culprit though.
Long story short, with CaCl2 the best results came from the 4M electrolyte, which gave a CE of around 96% and a capacity of about 2.57Ah/L, very similar to the best MgCl2 results. However, every CaCl2 battery had problems with iron oxide buildup on the anolyte side, and this makes it hard to compare the two salts in a fair way. Before going any further I want to repeat these tests with properly filtered electrolytes once the new PTFE filters arrive, and I will also look into better ways to deal with the Fe3+ impurities in the FeCl2.2H2O. As usual, the raw cycling data for these experiments will be released together with the rest of this first batch of results.

Thanks to NLnet for supporting this research!